Extracting Page Content
Everything the Page tab surfaces about the whole webpage: SEO and Open Graph meta tags, social preview cards for Facebook, X, and LinkedIn, SEO issues flagged with severity, a live page-weight breakdown, every image and SVG, the full colour palette, every typography style, and the frameworks powering the site.
The Page tab in the side panel collects page-level information that doesn’t belong to any single element. Activate Screen Ruler, switch the side panel to the Page tab, and everything below appears.
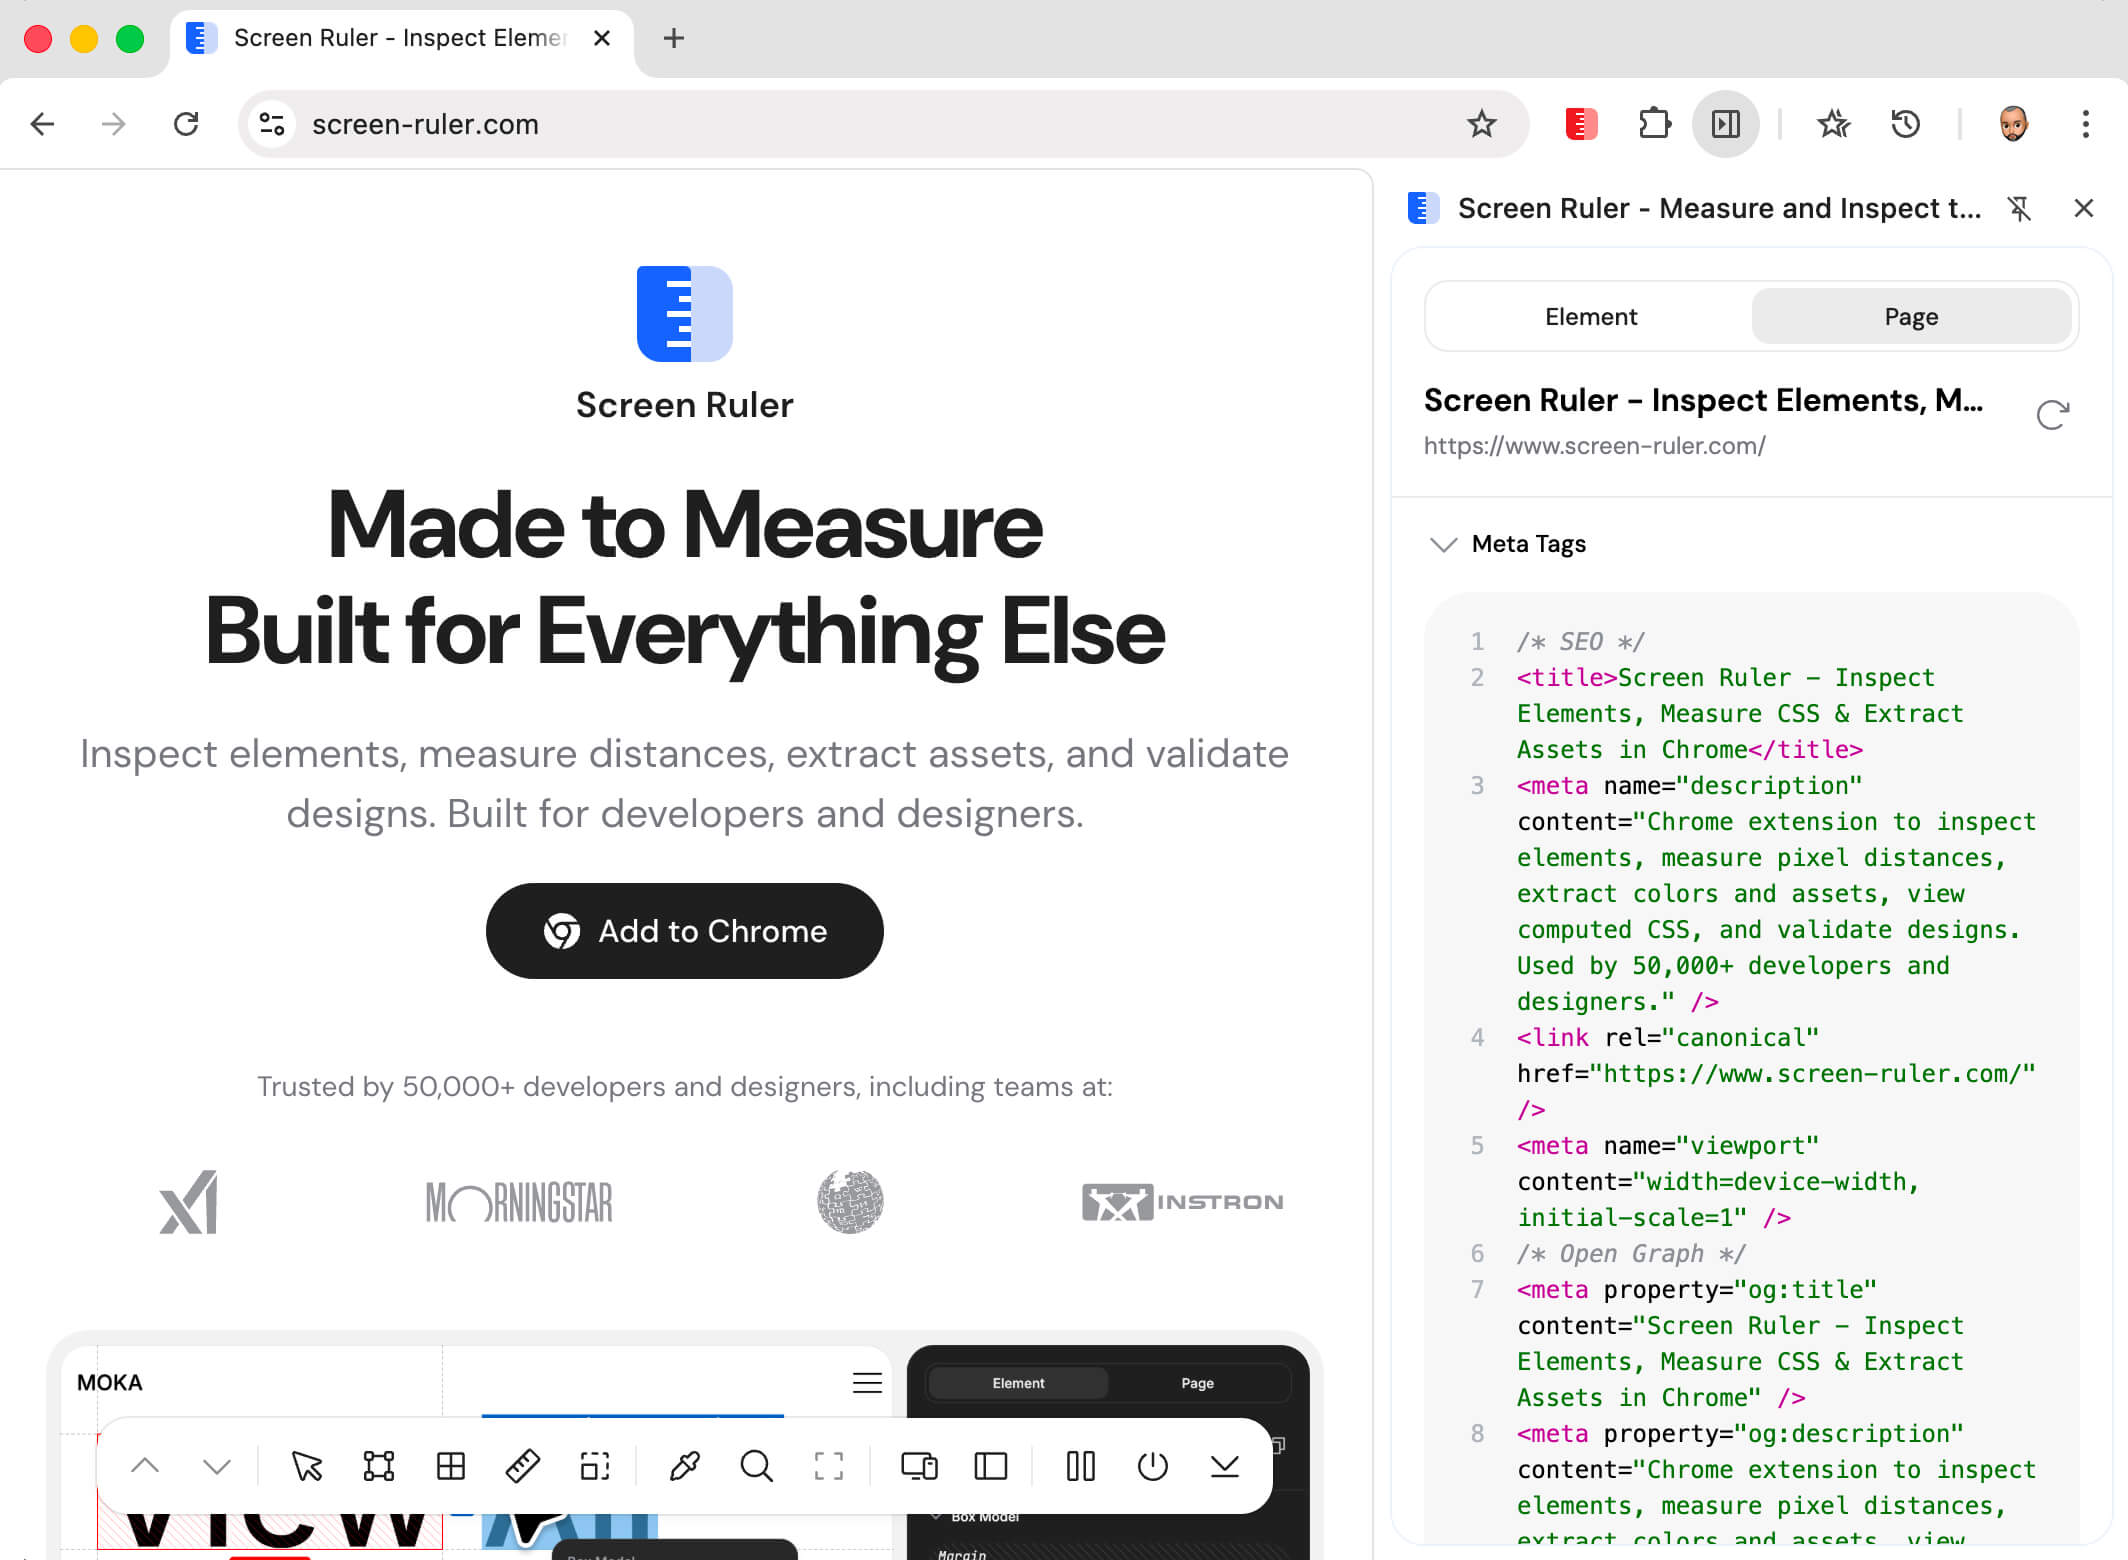
Meta Tags & Social Preview
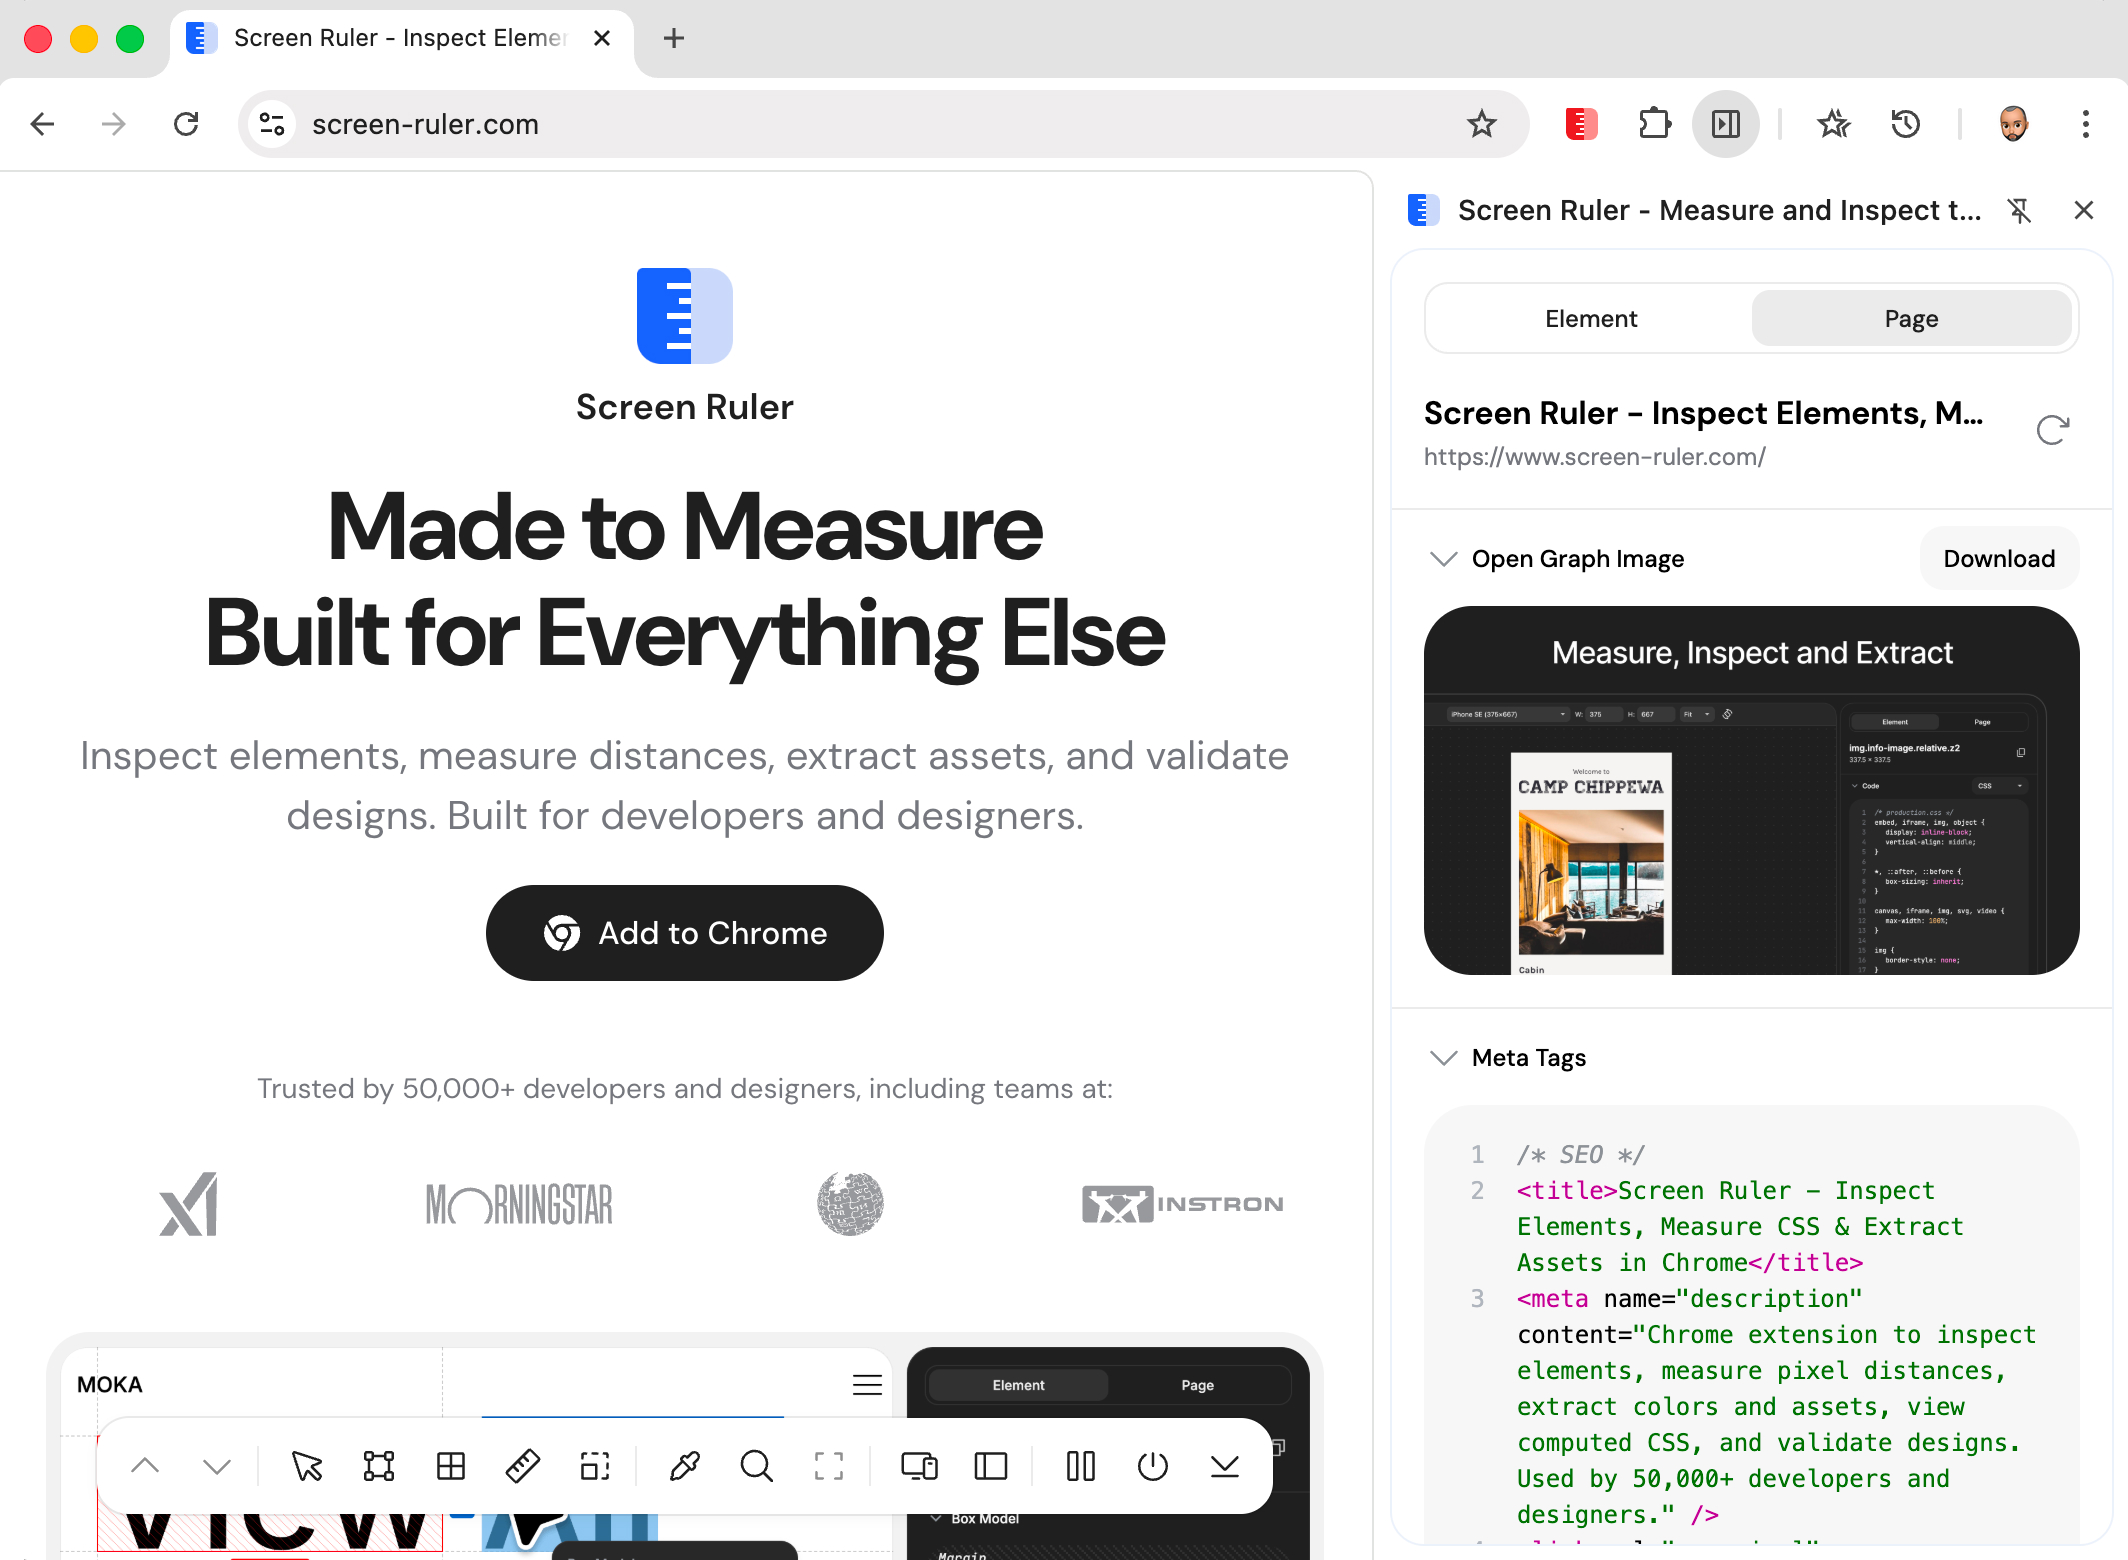
Screen Ruler reads <title>, window.location.href, and the page’s meta tags, then groups them into three sections in the side panel: SEO (description, canonical, robots, viewport), Open Graph (og:title, og:description, og:image, og:url, og:type, og:site_name), and Twitter (twitter:card, twitter:title, twitter:description, twitter:image, twitter:site).
The Social Preview section above the meta tag list renders an approximation of how the page looks when shared. Three platform variants are available via the dropdown: Facebook (large landscape image with domain, title, and description), X (image with the title overlaid on a dark gradient, no description, matching the summary_large_image card type), and LinkedIn (landscape image with title and lowercase domain). Each variant shows the field subset that the real platform displays.
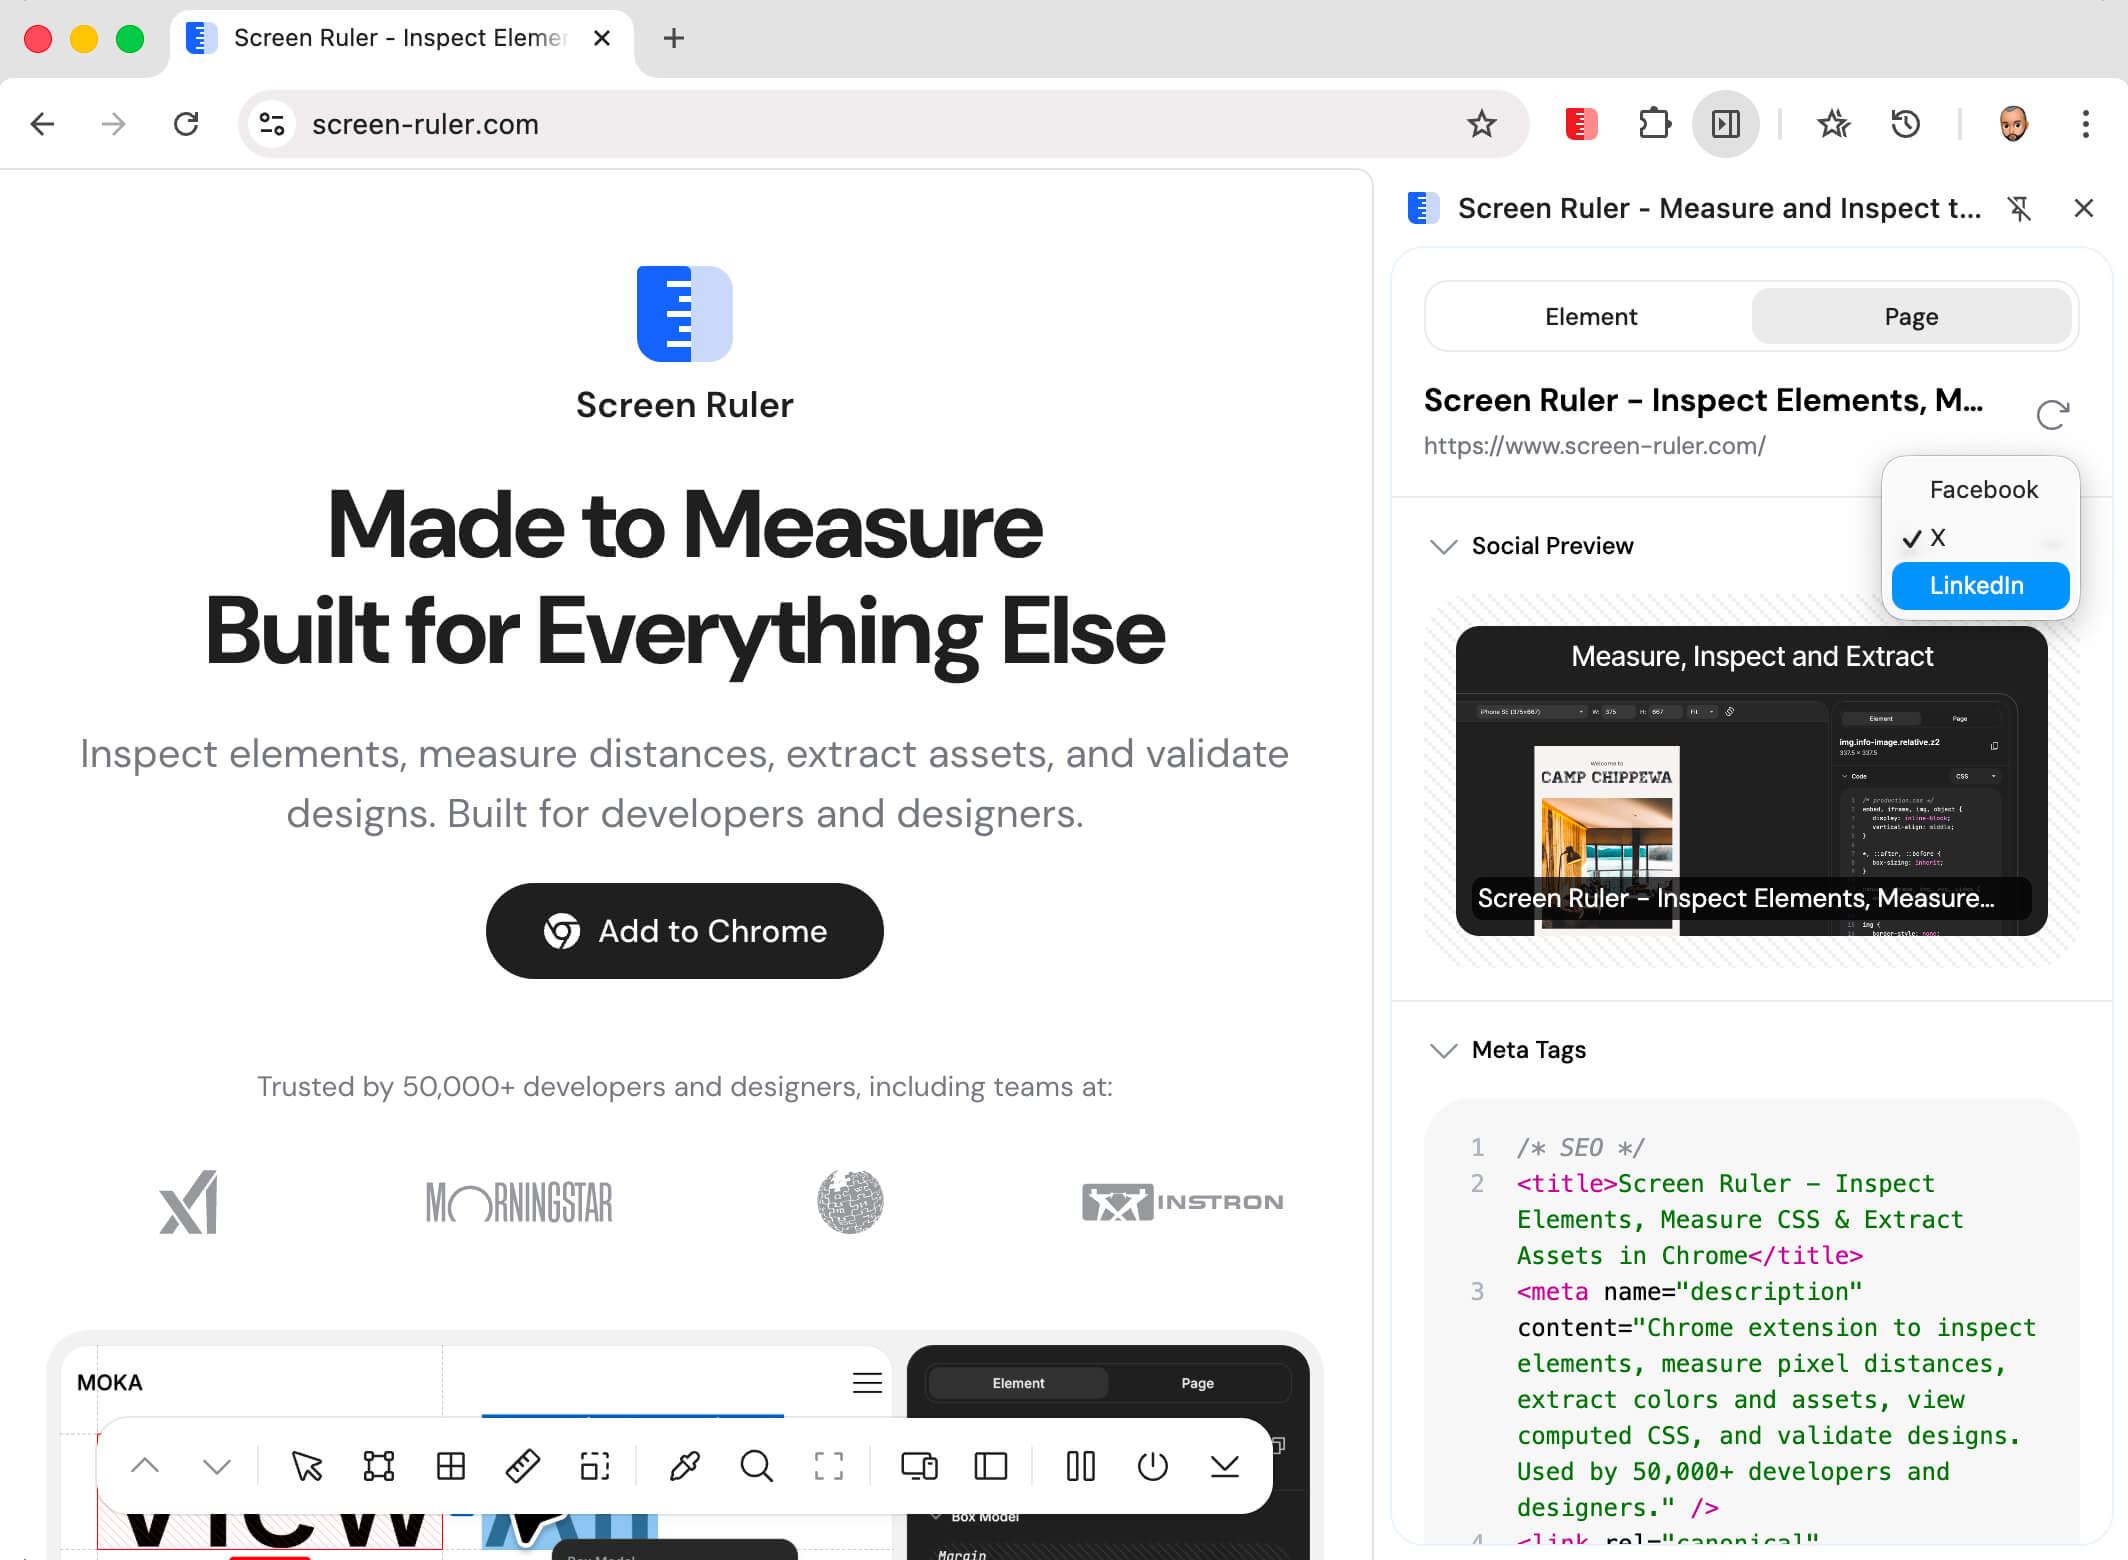
The preview only appears if the page has an og:image. The platform you pick is remembered between sessions. A refresh button at the top of the Page tab re-fetches metadata, so if you change the URL or update the page’s meta tags you can see the new values without reactivating the extension.
SEO Issues
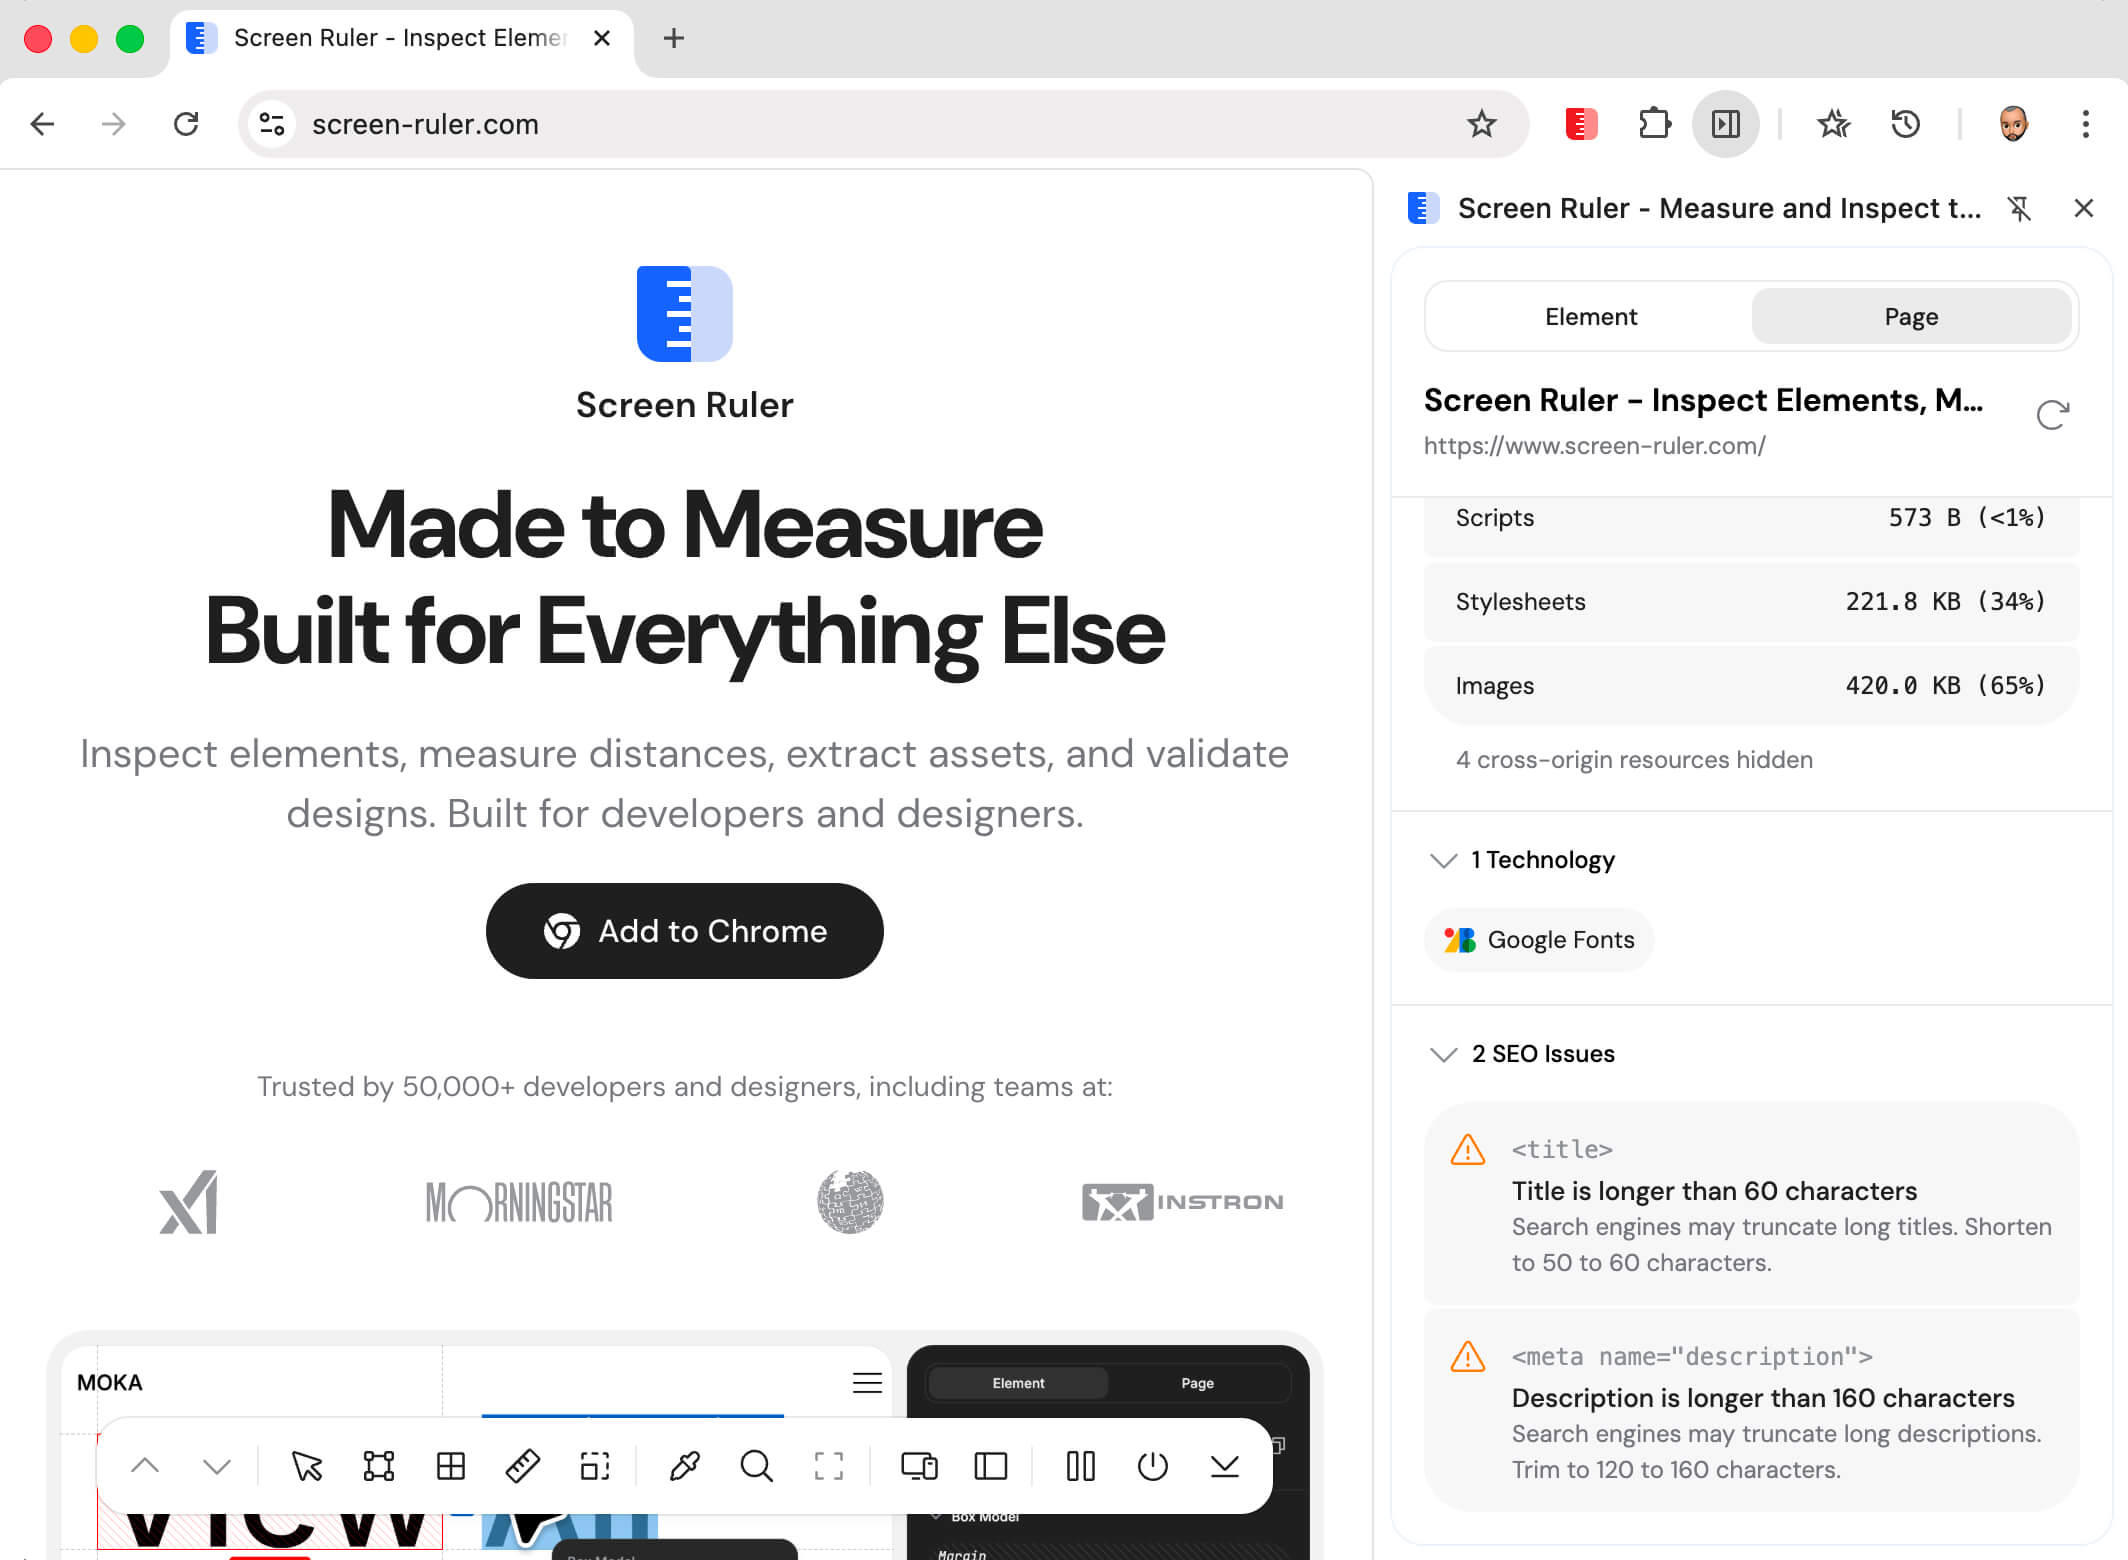
Screen Ruler runs a set of common SEO checks against the page and lists any problems it finds, sorted by severity (errors first, then warnings, then info notes). Checks include out-of-range <title> length, missing meta description, missing or duplicate <h1>, missing canonical link, missing viewport meta, missing lang on <html>, noindex robots directives, images without alt text, and missing Open Graph tags.
Most issues are static cards describing what’s wrong and how to fix it. Two are interactive: multiple <h1> tags and images missing alt group into a single card with a count badge, and the prev/next arrows cycle through each instance and highlight it directly on the page. The section is hidden entirely when nothing is wrong.
Page Weight
Page Weight breaks down what the browser actually downloaded for the current page by resource type: the HTML document itself, scripts, stylesheets, images, fonts, media, fetch and XHR calls, and other. A stacked bar visualises the proportions and a property list shows the exact byte counts and percentages.
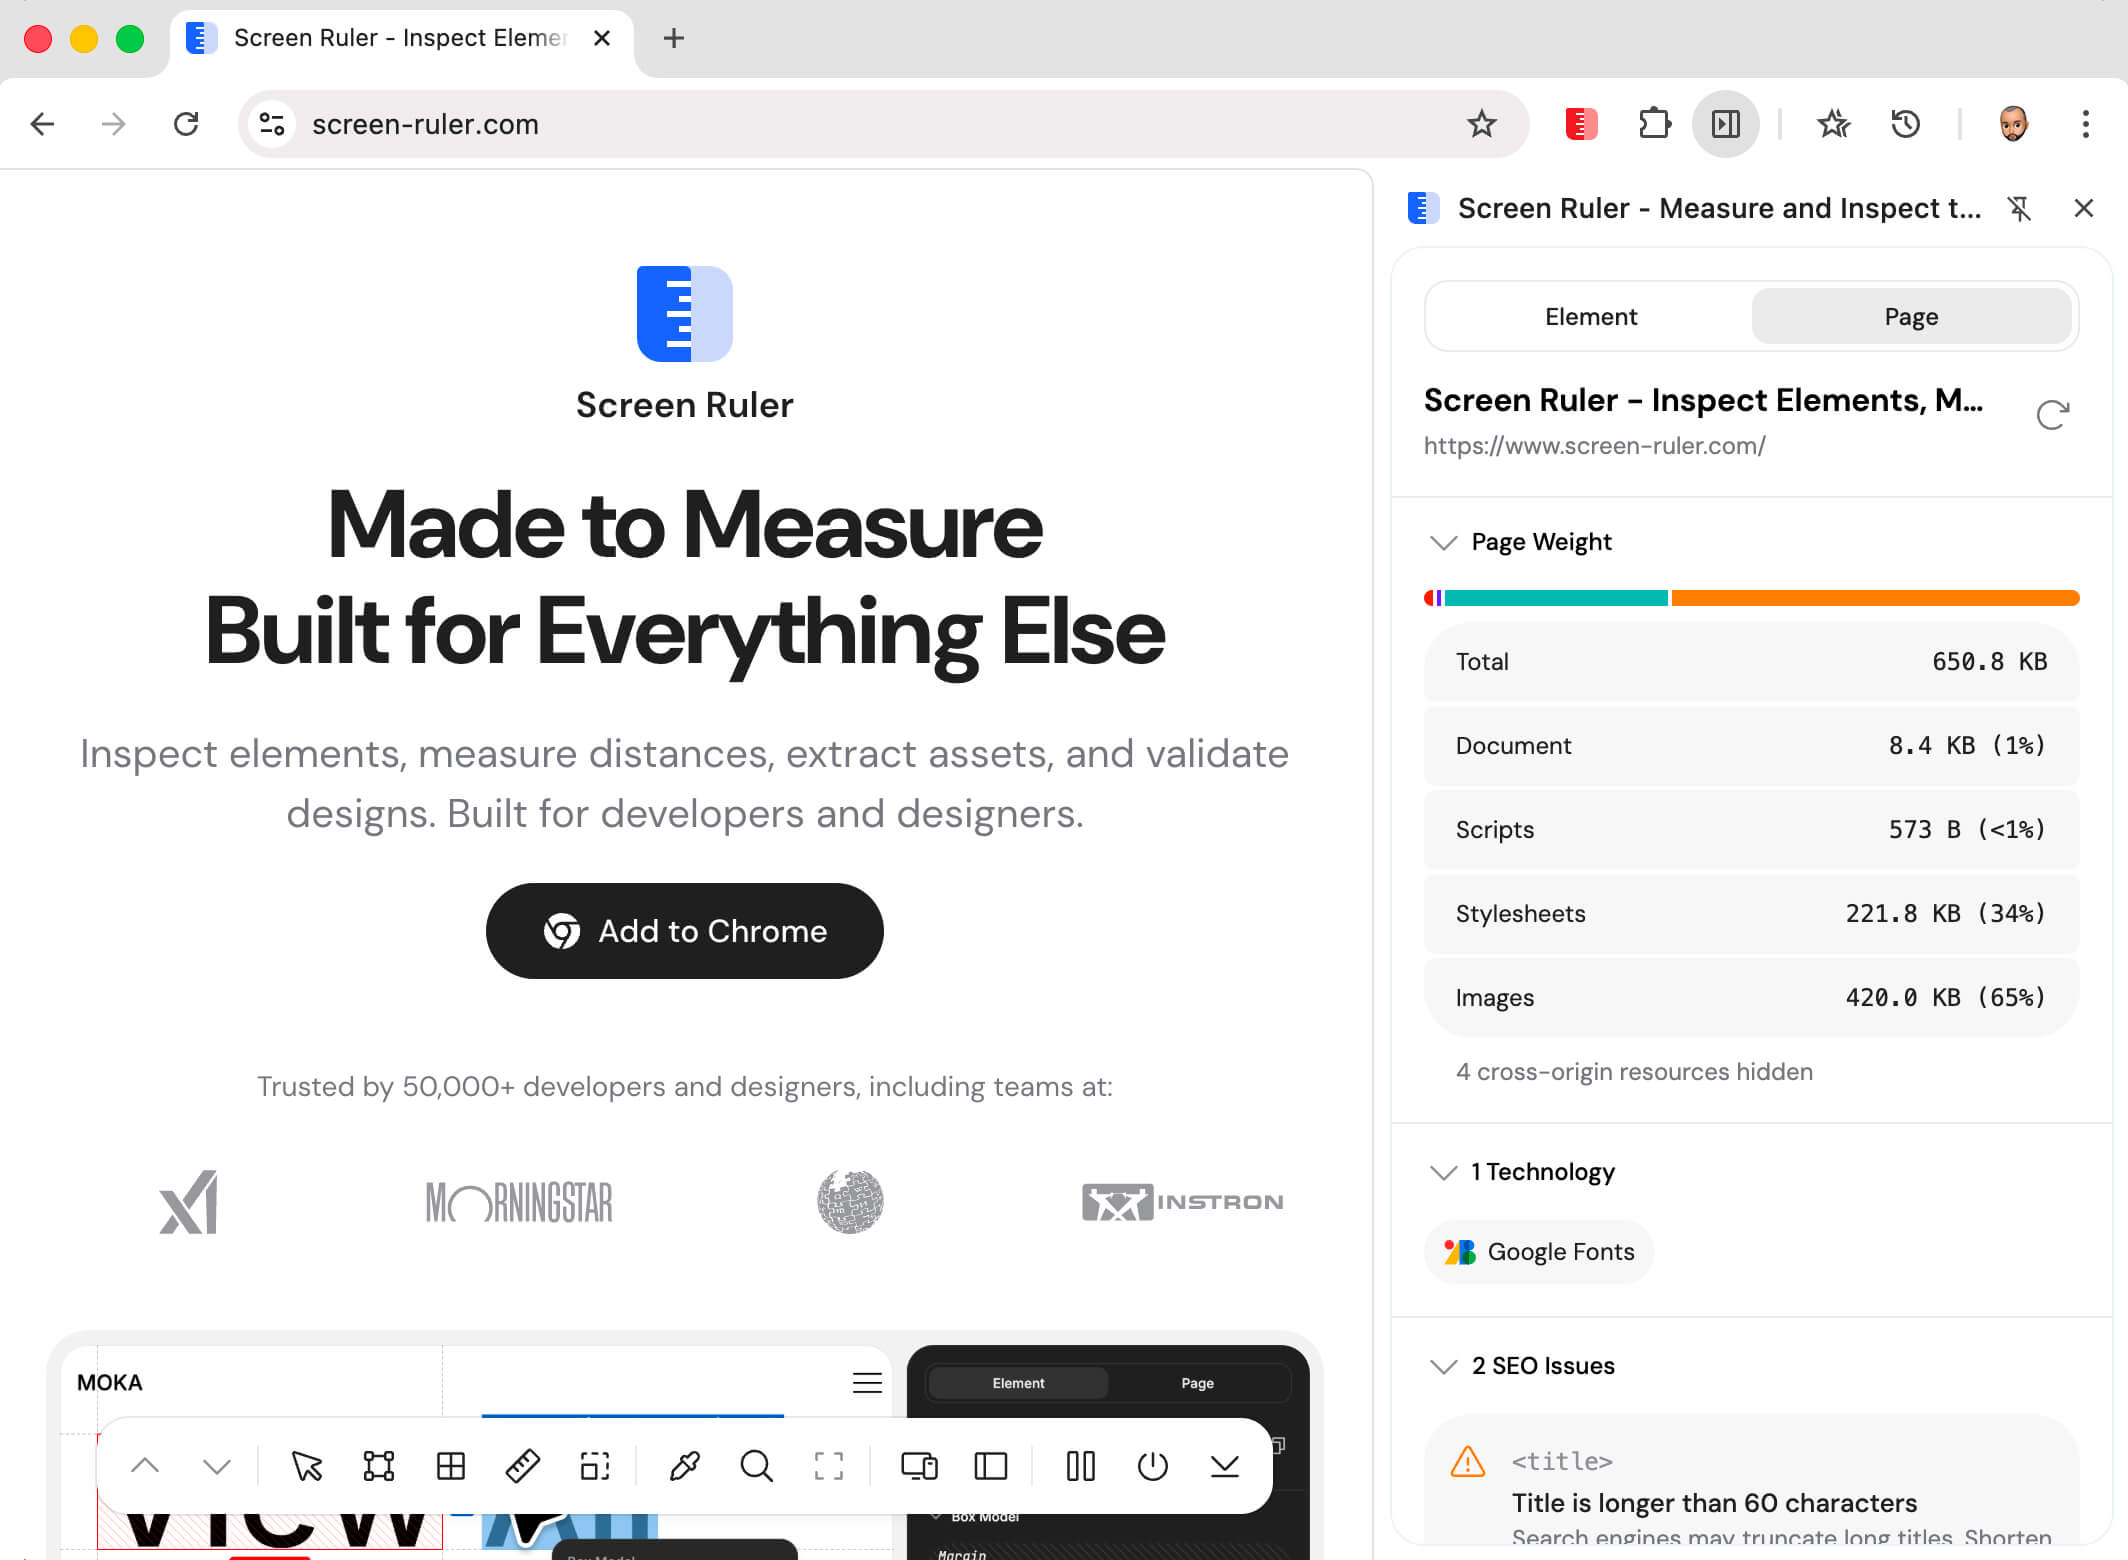
The numbers update live as the page loads. Data is collected through the browser’s Performance API (performance.getEntriesByType('resource')) and aggregated internally, so the count stays accurate even when the page’s own analytics scripts clear the resource timing buffer.
On client-side-routed apps (Twitter, Reddit, Next.js), the totals reset on each popstate or hashchange so the number reflects the current route rather than everything loaded since the tab opened. Cached resources are counted using encodedBodySize when the network transfer size is zero, so cache hits don’t silently undercount. Cross-origin resources without a Timing-Allow-Origin header have hidden sizes and are reported as a separate count under the breakdown.
Asset Extraction
Asset extraction walks the DOM recursively and collects every visual asset on the page: <img> sources (PNG, JPG, WebP, GIF), CSS background-image URLs (including data URLs), and inline <svg> elements which are serialised via XMLSerializer so you get the raw markup. Tiny tracking pixels are filtered out by minimum size thresholds.
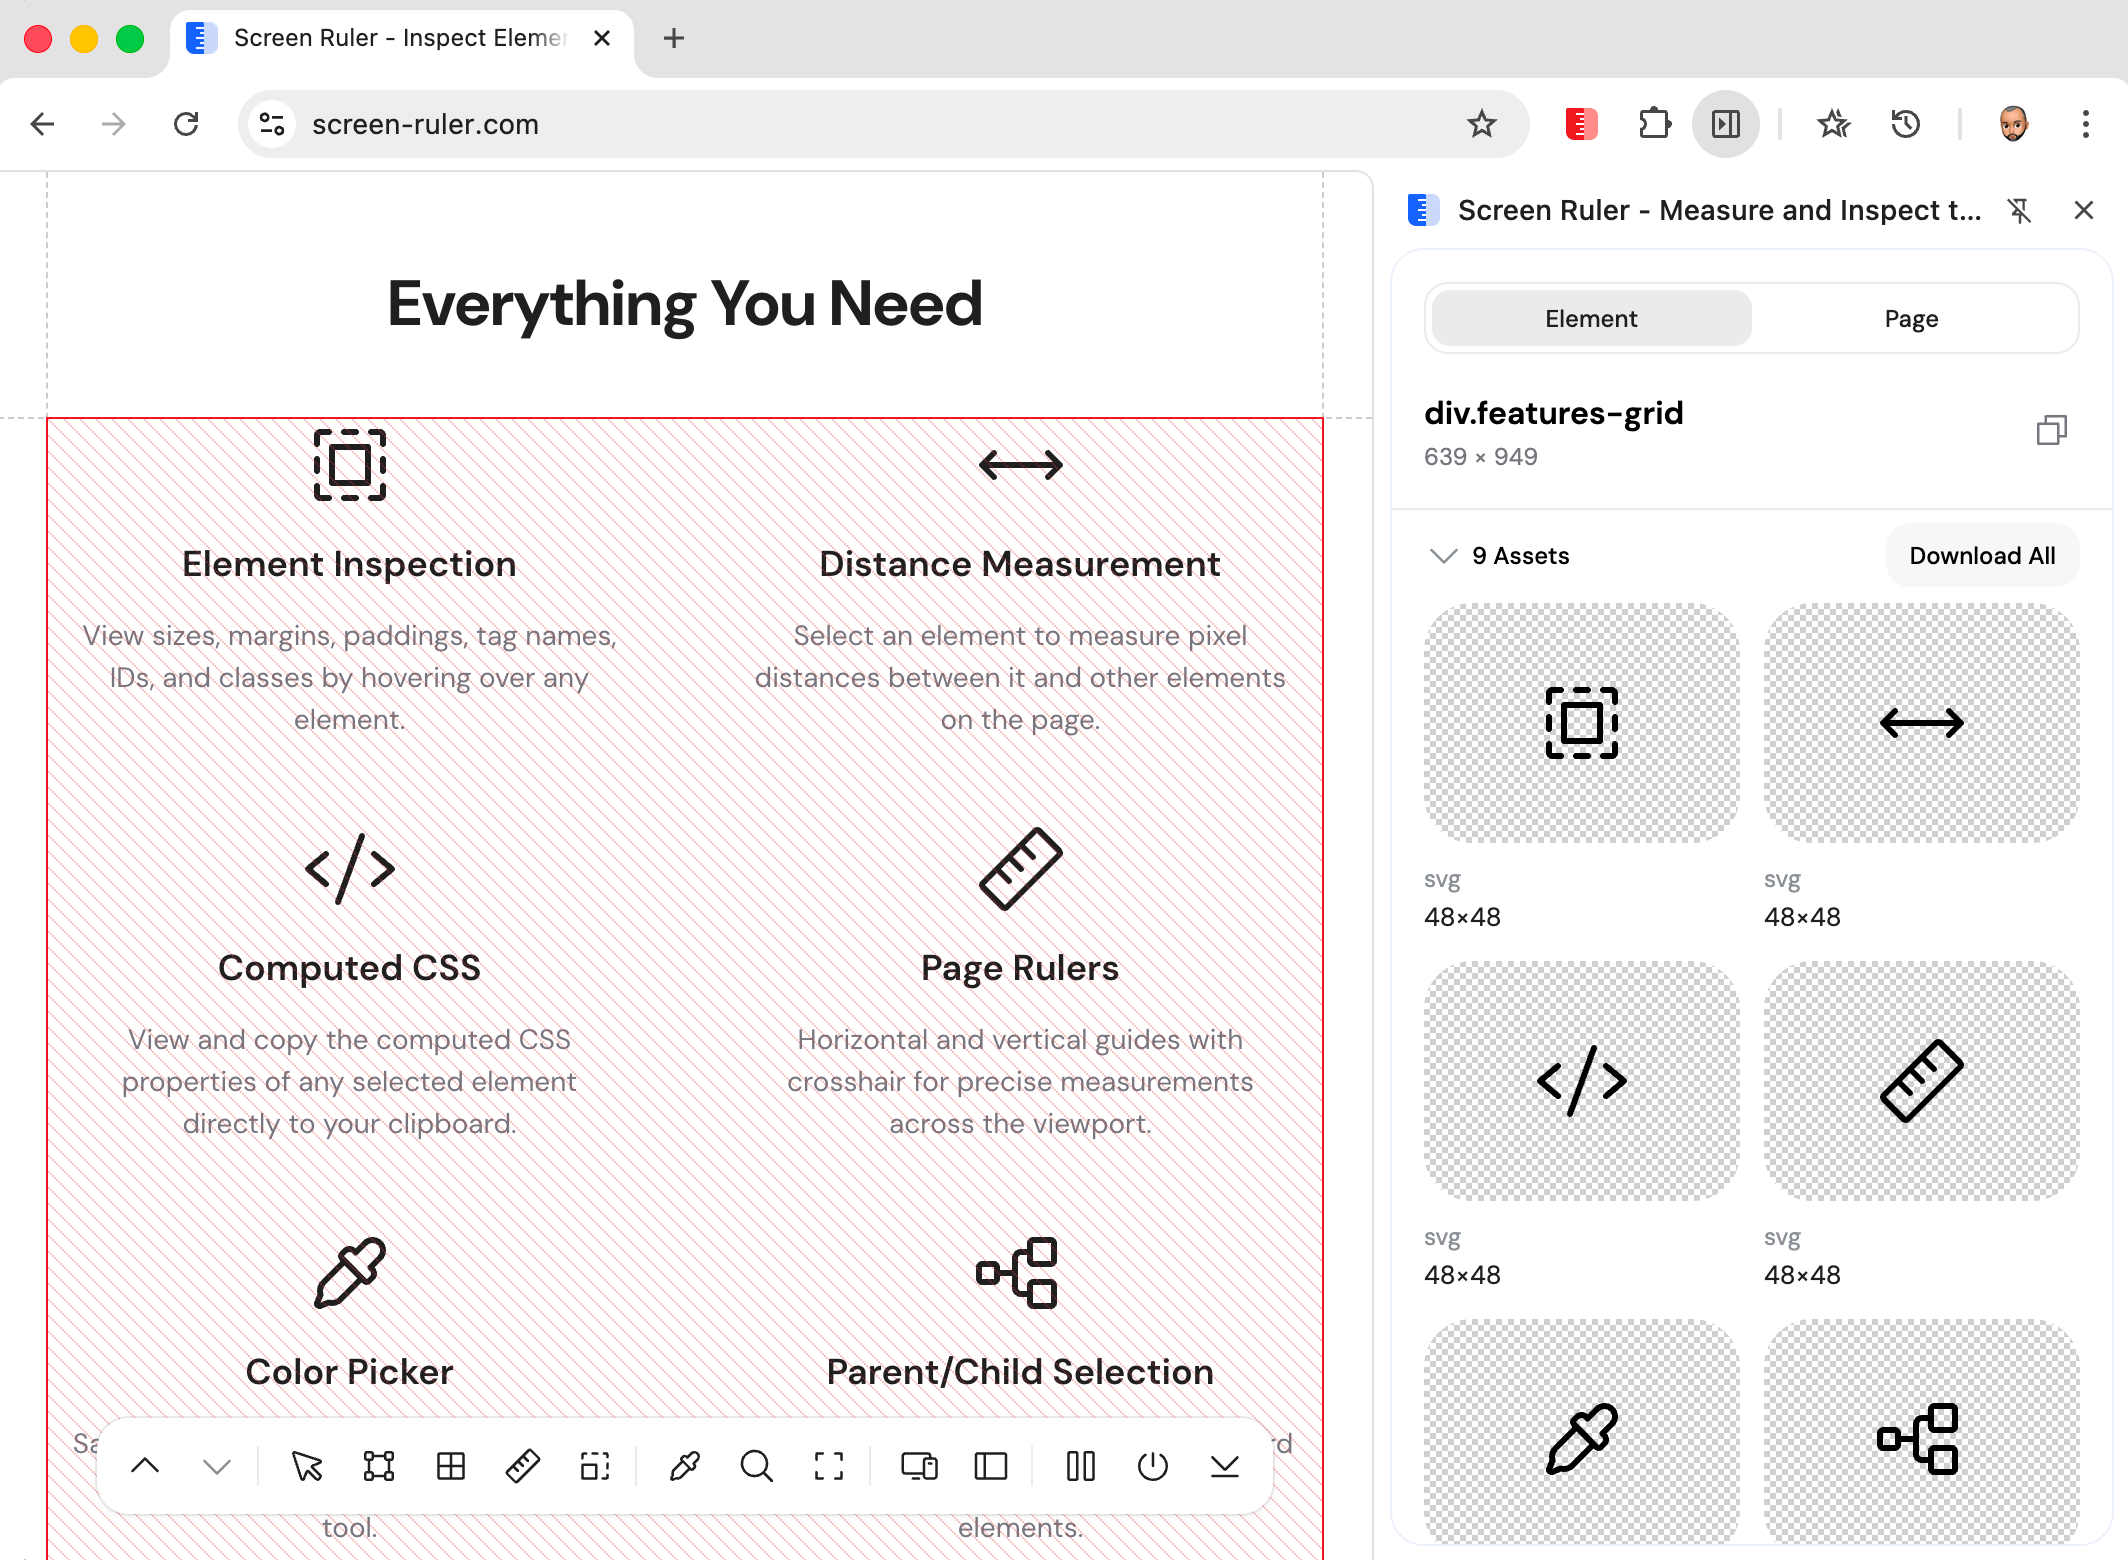
Each thumbnail shows rendered dimensions overlaid and a format badge (PNG, JPG, WebP, GIF, SVG). Individual download buttons save with sensible filenames; “Download all” grabs the whole set sequentially.
Color Extraction
Color extraction collects every unique colour on the page, categorised by where it’s used: text, background, or border. Modern colour spaces (oklch(), oklab(), lch(), lab(), hwb(), color()) are normalised through full conversion paths, and semi-transparent colours are properly composited.
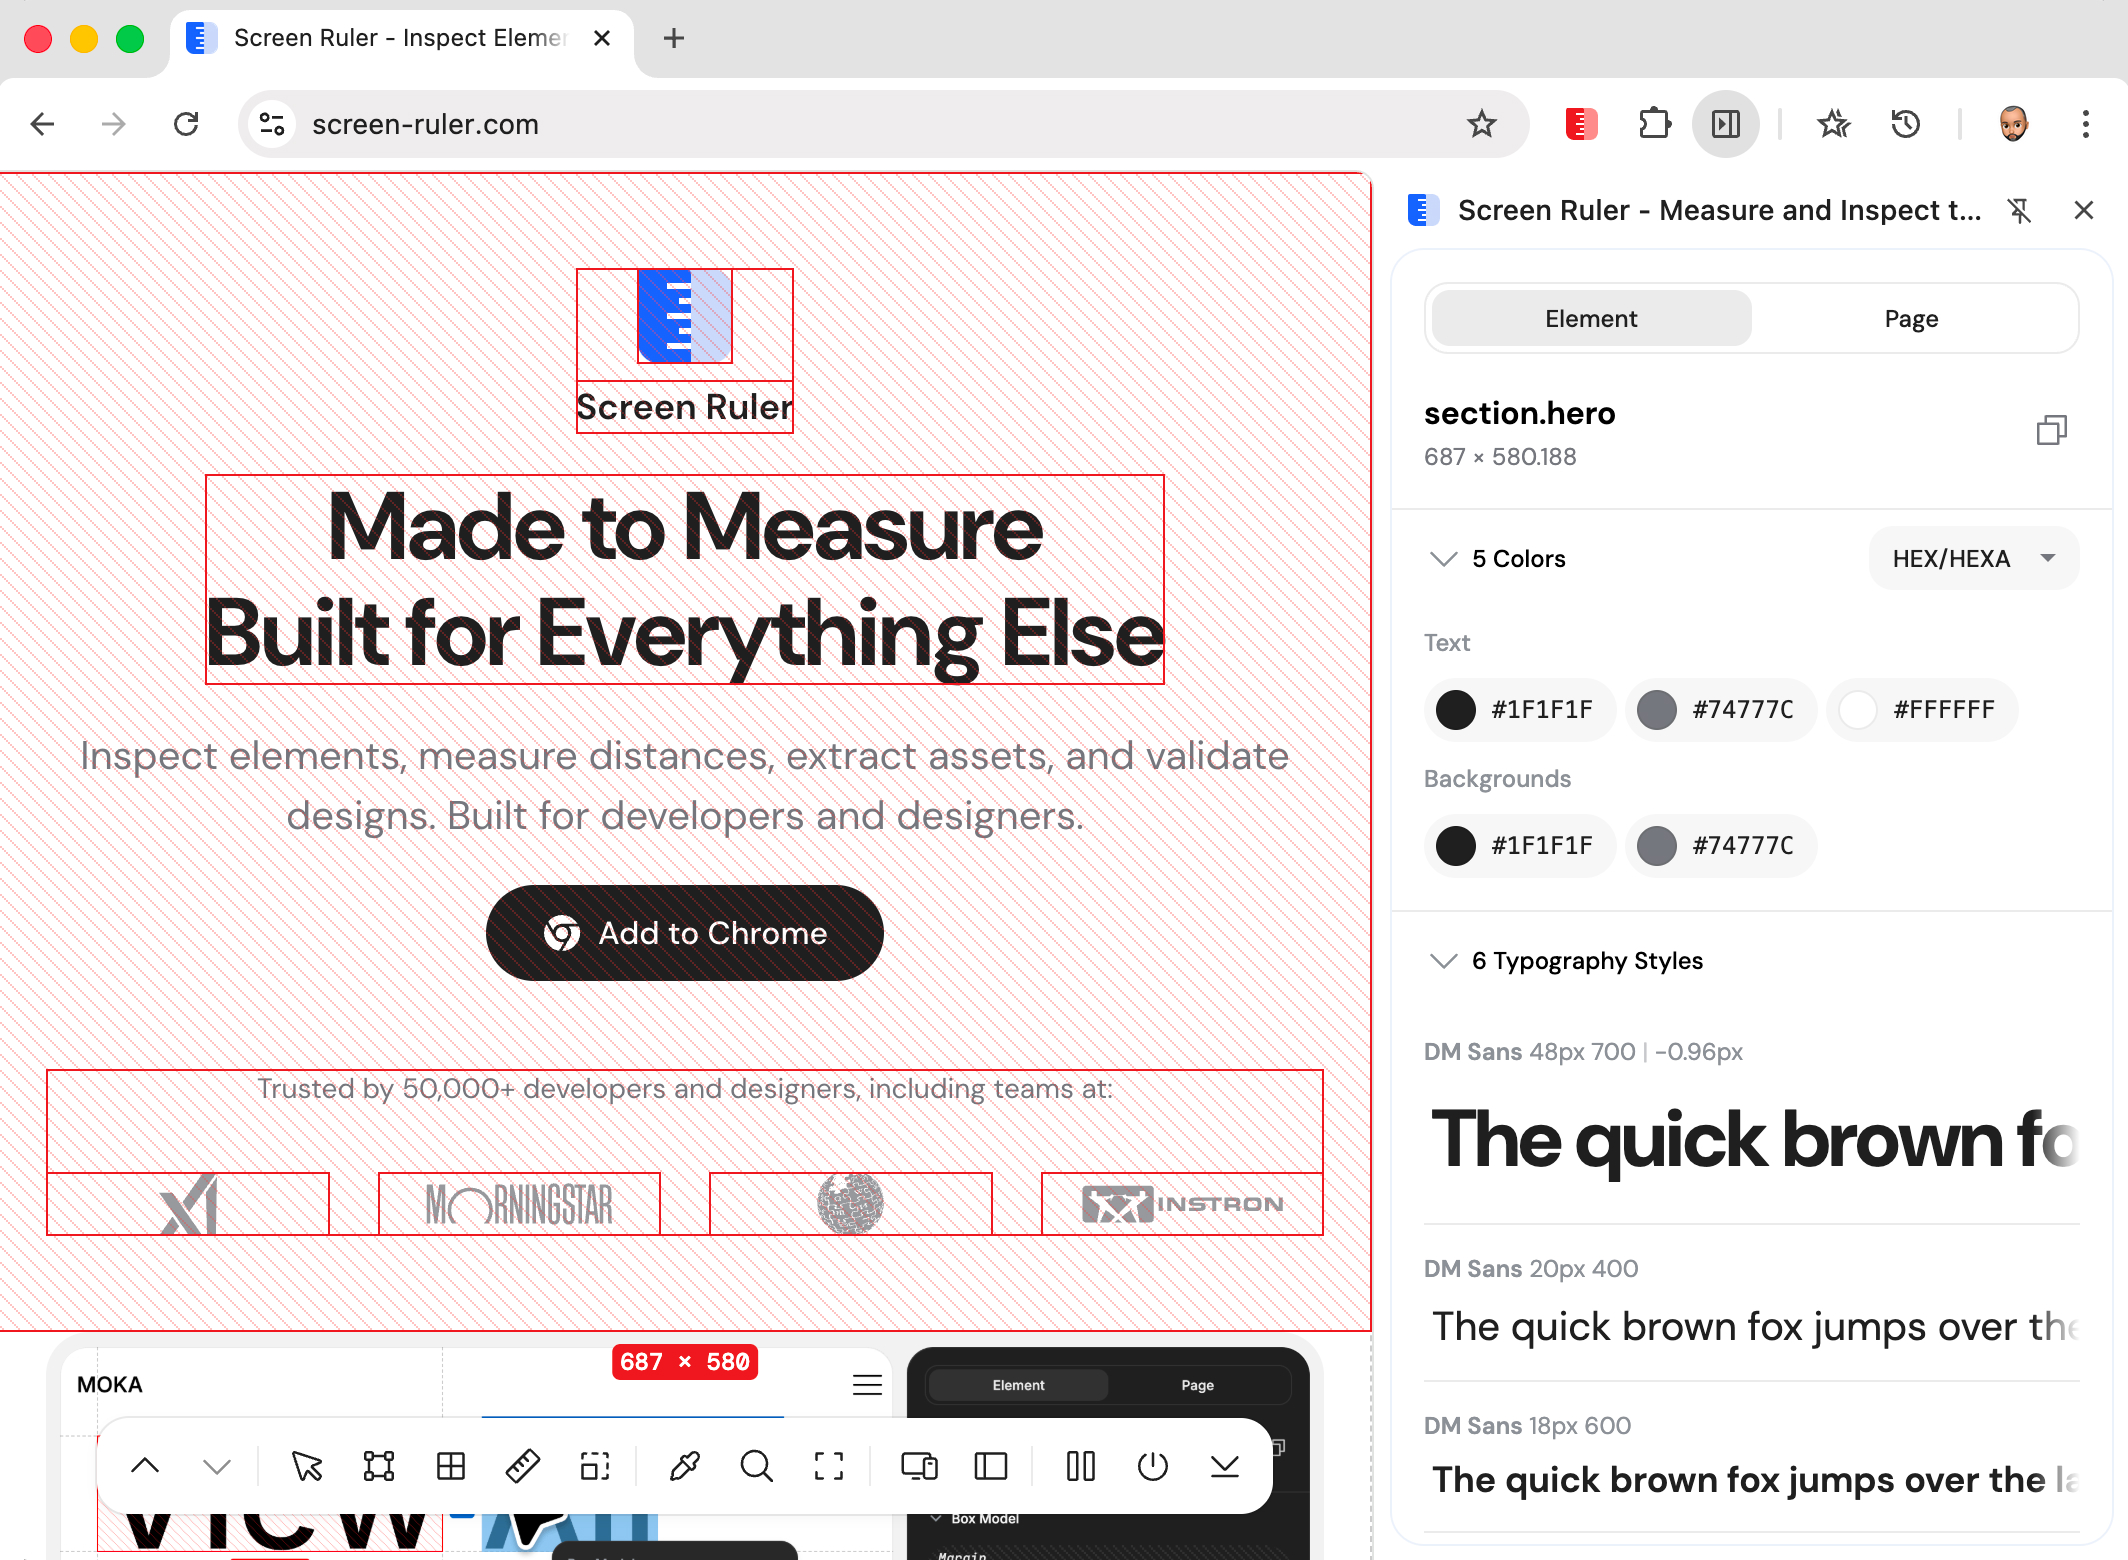
Hover any swatch to highlight every element on the page using that colour — the fastest way to find every place a stray legacy value still appears. The format dropdown switches all colours at once between HEX, RGB / RGBA, HSL / HSLA, and HSB / HSBA.
Typography
Typography analysis samples the text-containing elements on the page and extracts the unique combinations of font-family, font-size, font-weight, letter-spacing, and text-transform in use. Each unique combination is shown as a card with a rendered specimen of the actual typeface.
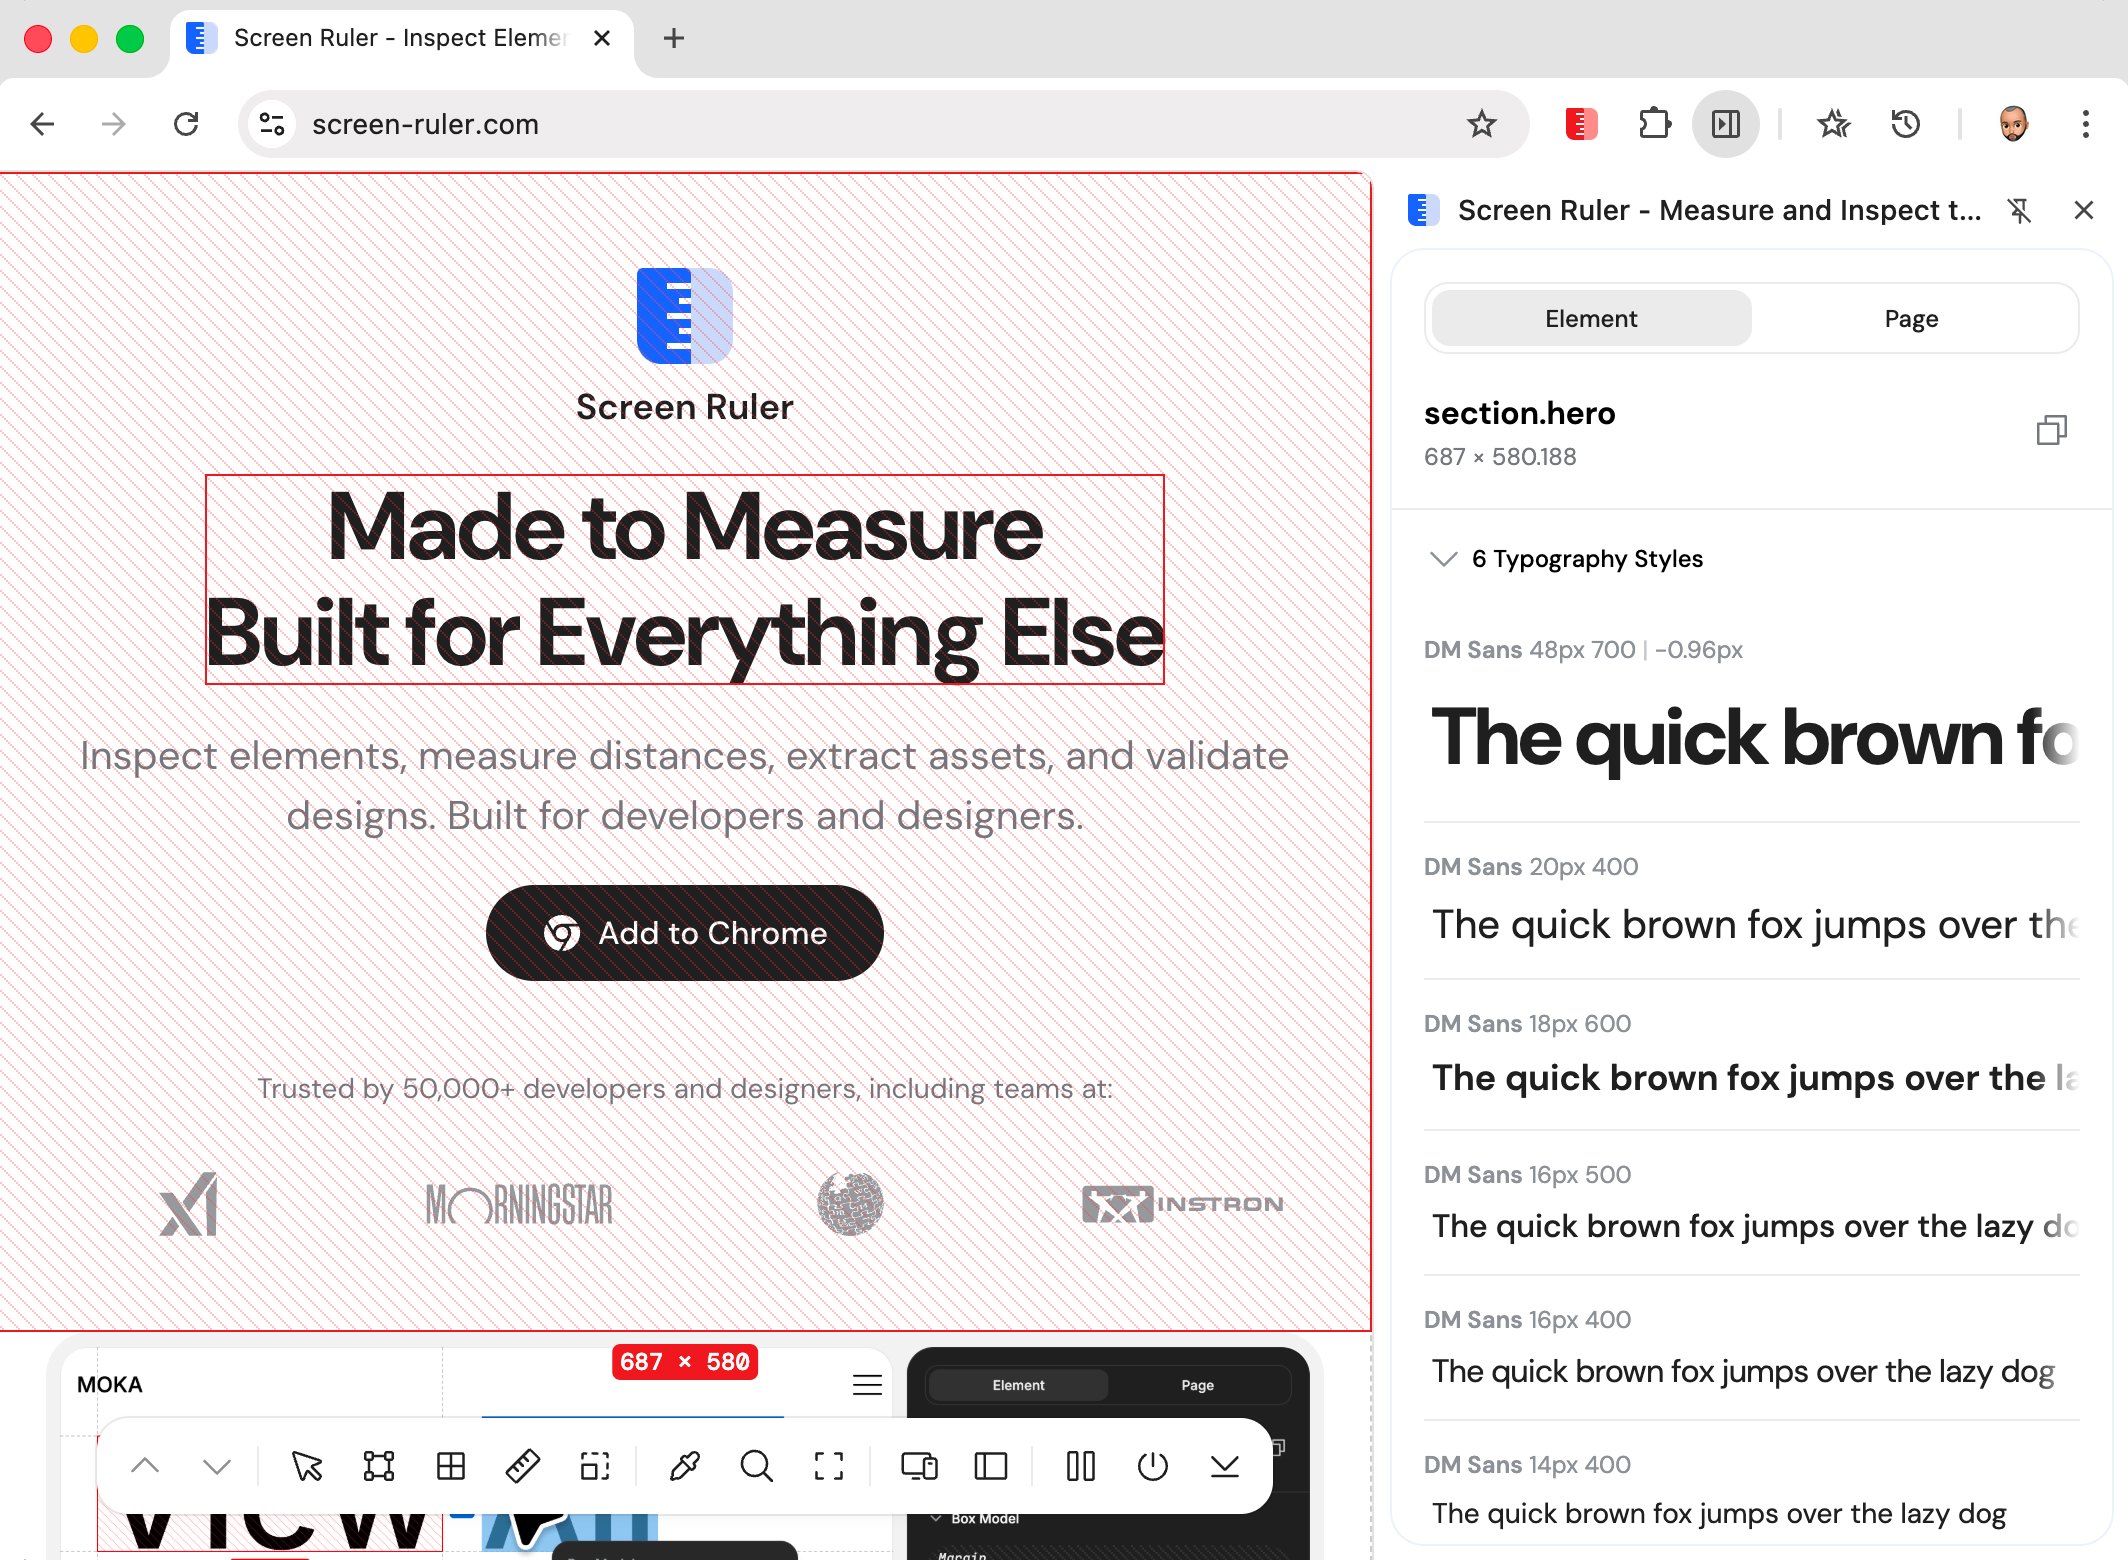
The renderer queries the actual rendered font (resolving the font-family fallback chain), so even when a stack like "Inter", system-ui, sans-serif resolves down to whatever is installed, the specimen reflects what visitors see — not just what the CSS hopes for.
Hover any typography card to highlight every element on the page using that style.
Technology Detection
Screen Ruler detects 180+ frontend technologies via pattern matching and global variable inspection. Detection uses multiple layers: window object property checks (e.g. window.React, __NEXT_DATA__), DOM attribute scans (data-reactid, ng-version), <meta> tag parsing, script src patterns, and CSS custom properties (--tw-* for Tailwind). Versions are extracted where libraries expose them. The detected technologies appear in the Page tab alongside the SEO checks shown above.
Detection covers frameworks (React, Vue, Angular, Svelte, Next.js, Nuxt, Astro, Remix, Qwik), UI toolkits (Tailwind, Bootstrap, Material UI, Chakra, Ant Design), CMS & commerce (WordPress, Shopify, Wix, Sanity, Contentful), build tools (Vite, Storybook), state management, charts (D3, Three.js, Chart.js), animation libraries (GSAP, Framer Motion), analytics (GA4, Plausible, PostHog, Sentry), and many more. Detection runs locally in the browser so it works on local development pages, intranet sites, and anything behind authentication.